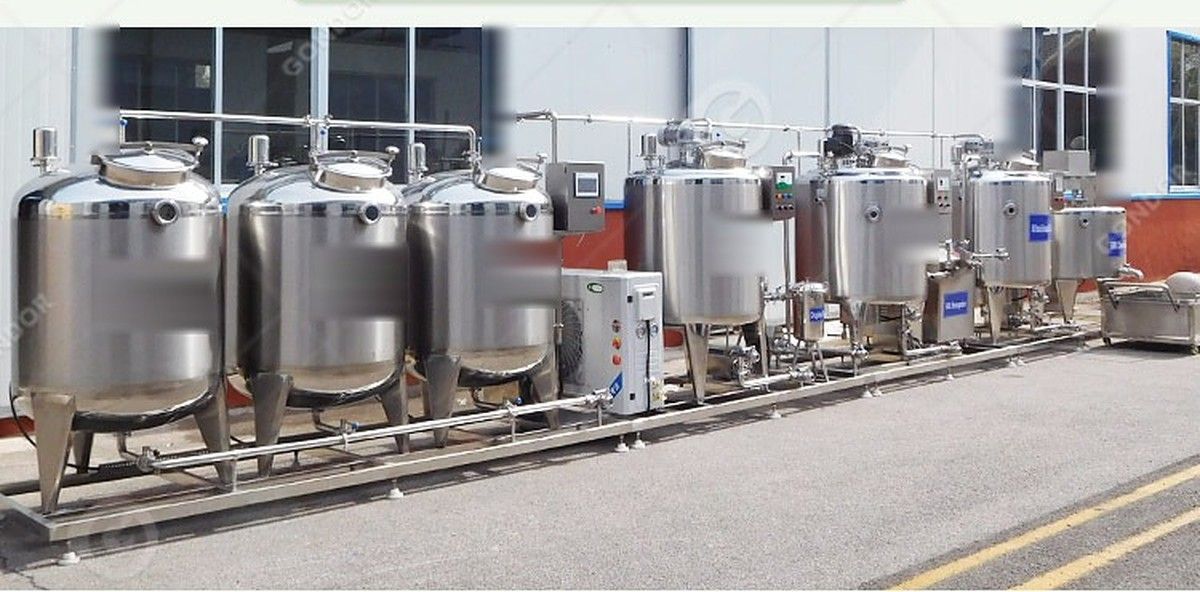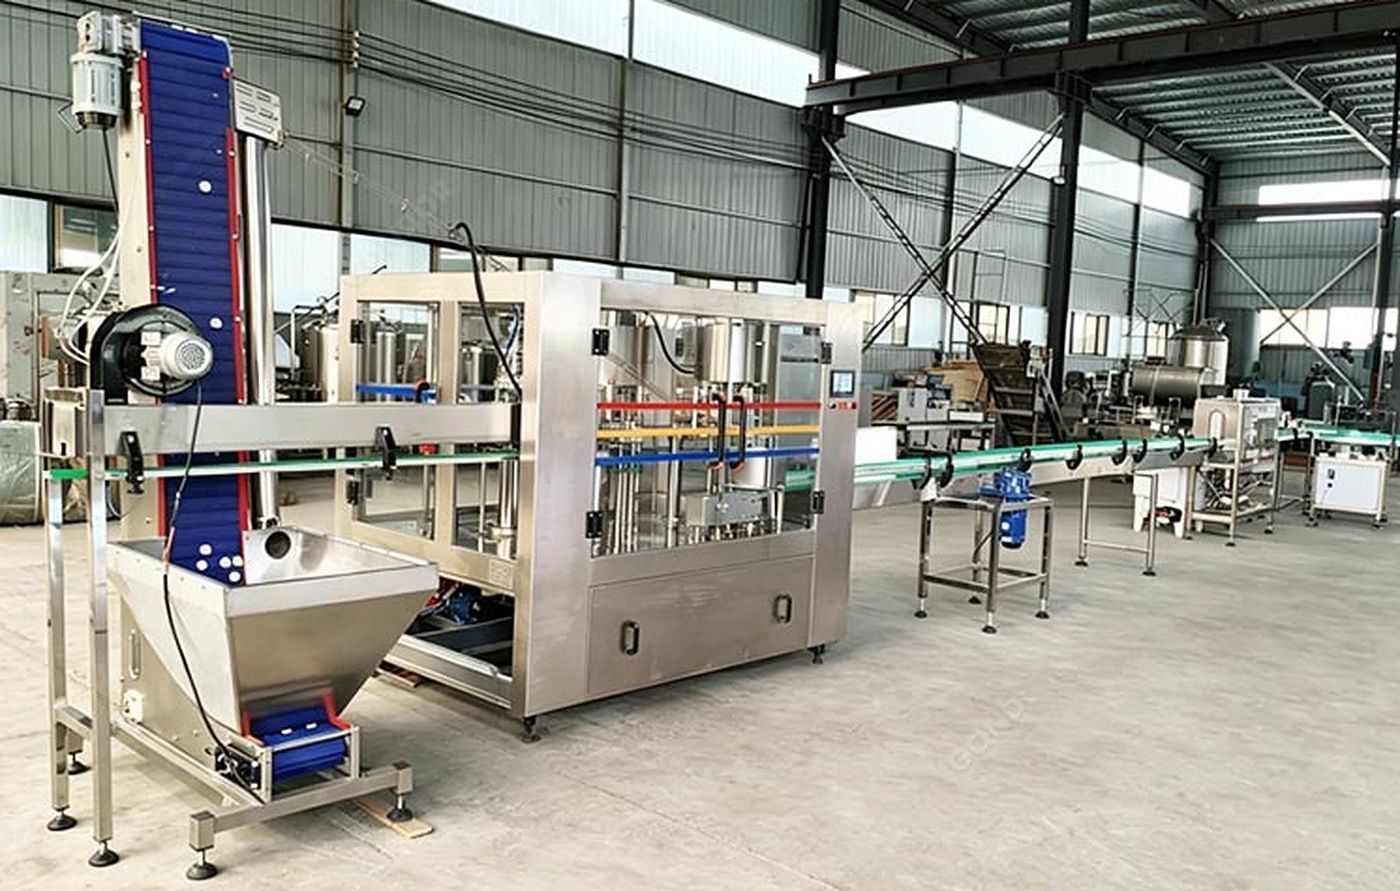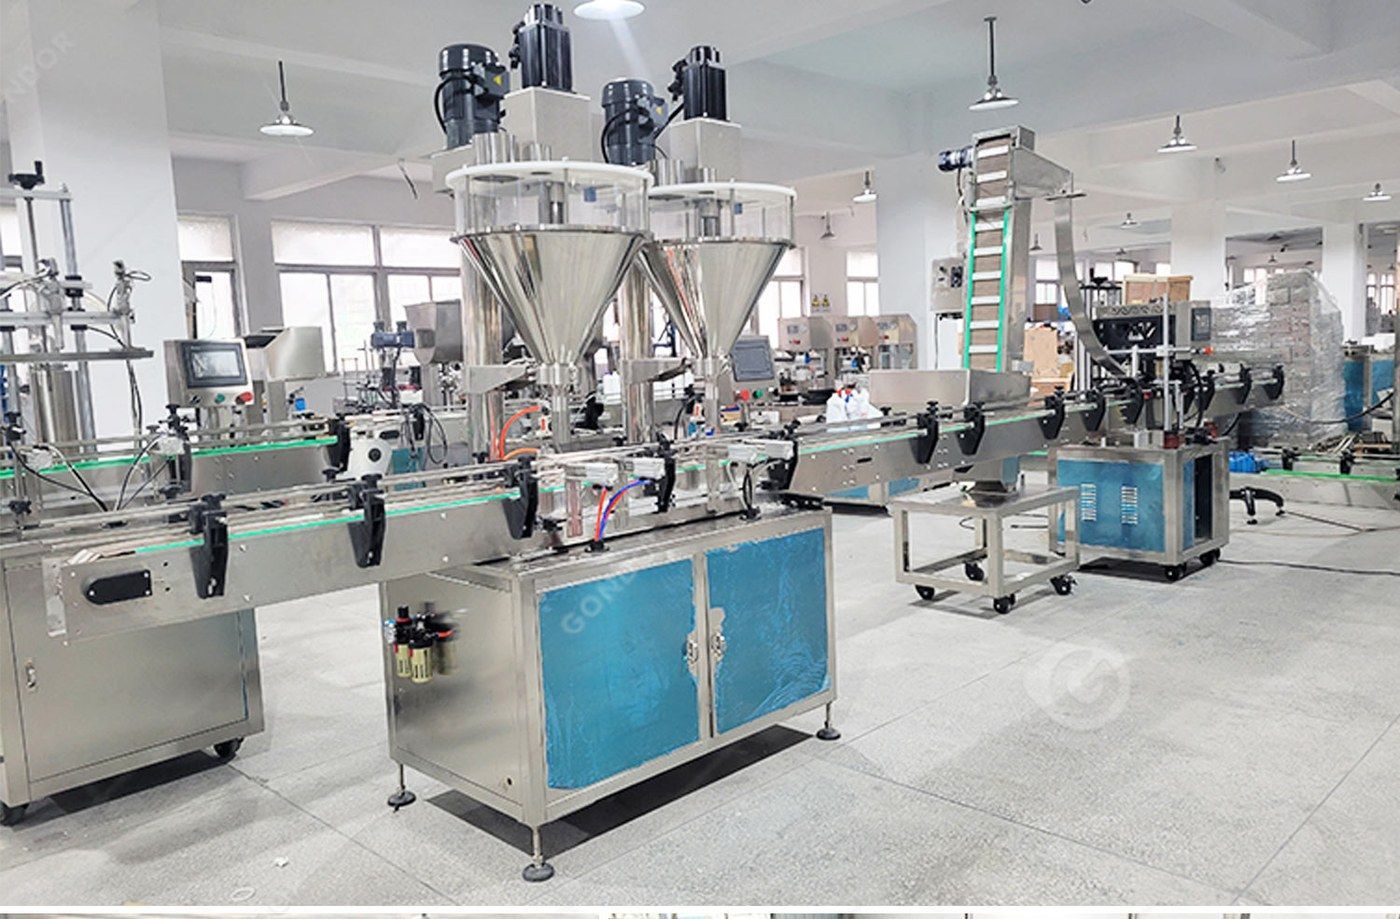


Liquid Filling Production Line
A liquid filling line produces only as quickly as its limiting operation can supply acceptable bottles. A filler rated at 100 bottles per minute cannot deliver that output if the capper, labeler or manual packing stage consistently accepts fewer bottles.
Find the limiting stage by measuring actual flows and stoppages at the required bottle format, rather than comparing maximum catalog speeds.
Put every station on the same basis
List the bottle feeder, filling machine, capper, labeler and packing operation. For each one, record the running speed, operating availability and number of accepted bottles.
Use the same liquid, fill volume, bottle, cap and label throughout the comparison. A filling demonstration with a small dose and a labeling demonstration with a different bottle do not establish the capacity of one combined line.
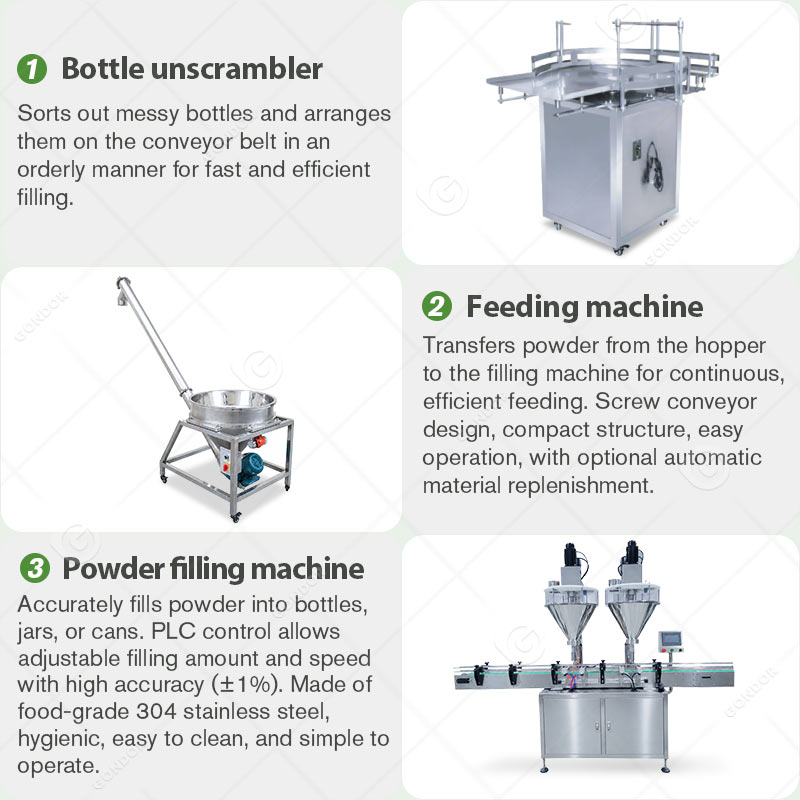
The supplied liquid-line arrangement includes bottle handling, filling, capping and labeling. Secondary packing and inspection should be listed separately if they are part of the required project.
A simple bottleneck calculation
Assume the following sustainable rates for one agreed format:
| Operation | Accepted capacity while running |
|---|---|
| Bottle feeding | 90 bottles/min |
| Filling | 80 bottles/min |
| Capping | 70 bottles/min |
| Labeling | 85 bottles/min |
The capper limits this example to 70 bottles/min before line interruptions. Improving the filler from 80 to 100 bottles/min will not remove that constraint.
These numbers illustrate a method. They are not measured ratings for the current product line.
Why buffers help only for a limited time
An accumulation conveyor can allow adjacent stations to keep running through short interruptions. It cannot fix a permanent mismatch in average capacity.
Suppose a filler supplies 80 bottles/min while the capper handles 70. The queue grows by 10 bottles/min. A buffer with 100 usable bottle positions fills in approximately ten minutes, after which the upstream station must slow or stop.
Buffer time = usable bottle positions ÷ difference in bottle flow.
Check the actual usable positions for the bottle shape and spacing. Conveyor length alone does not define effective accumulation capacity.
Observe blocking and starvation
A station is blocked when it cannot discharge because downstream space is unavailable. It is starved when upstream product or packaging does not arrive. Recording those states helps distinguish a slow machine from a machine waiting on another part of the line.
For example, a filler that repeatedly waits for bottles may have sufficient filling capacity. The problem may be bottle orientation, a transfer point or the timing of the upstream feeder.
Similarly, frequent cap shortages can reduce capping output even when the tightening mechanism is fast enough. Separate cap supply faults from cap-application faults in the downtime record.
Translate speed into shift output
Start with the limiting accepted rate and multiply by the time the integrated line actually runs. If a line produces 70 accepted bottles/min for 360 productive minutes, the result is 25,200 accepted bottles.
Do not multiply by the full shift length if product changeover, cleaning or planned stops use part of that shift. Define which losses are included so allowances are not counted twice.
What to ask during a line trial
Run the connected equipment for an agreed duration with production packaging. Record accepted bottles, rejects and stop causes. Include at least one intended format change when changeover is material to the project.
Ask what controls coordinate starts, stops and accumulation. A shared control screen is useful, but the proposal should explain how stations respond when another station stops or the product supply changes.
Create a short observation record before buying capacity
Observe the current or proposed connected line for a defined period at a stable product and format. For each stop, record start time, duration, location and the reason known at that point. Mark uncertain causes as uncertain rather than assigning them automatically to the machine that happens to be stopped.
Also note whether the station is blocked, starved or unable to perform its own operation. Those categories explain why an apparently slow machine may only be waiting. They help direct a later trial toward the actual constraint.
Use consistent event definitions across operators. A capper waiting for caps and a capper unable to tighten a correctly presented cap are different events and may need different corrective work.
Distinguish brief interruptions from a permanent mismatch
A buffer can bridge a temporary stop when the downstream station later has enough spare capacity to recover. If the downstream average remains lower than the upstream average, accumulation continues to grow.
For an illustrative recovery event, suppose a downstream station temporarily loses two minutes while the upstream station supplies 60 bottles/min. The queue gains 120 bottles if enough accumulation is available. If the downstream station then runs 10 bottles/min faster than the incoming flow, clearing that queue takes about twelve minutes.
The calculation assumes those rates remain available and ignores other interruptions. Its purpose is to test the buffer-and-recovery idea against a defined event. Conveyor space alone does not demonstrate that a line can recover its lost production.
Examine changeover losses separately from running losses
A line that runs well for one format may spend much of the day changing product, bottle or label. Record the final accepted bottle from the previous SKU and the first stable accepted production from the next one.
Include cleaning, parts changes, adjustment and verification in that interval where they are part of the actual operation. A controller recipe may shorten setup without removing the physical work needed at guides, closures or labeling.
Compare the production schedule with the SKU mix. Increasing running speed offers a different benefit in a long single-product campaign than in a day dominated by small batches and frequent changes.
Use accepted output without double counting losses
Define whether the rate in your calculation already excludes rejects. If it does, do not apply the same reject allowance again. Likewise, if productive minutes already exclude changeover and cleaning, avoid deducting those intervals a second time.
For an example, 50 accepted bottles/min for 300 productive minutes gives 15,000 accepted bottles. If that running rate already represents accepted bottles, applying another general quality factor would change the basis without additional evidence.
Keep the calculation simple enough that each loss appears in one place. This makes it easier to compare estimates with the actual trial record and to identify where an improvement changes the result.
Review the format that is hardest to handle
The liquid-packaging planning guide connects filling, closures and format changes. Use it to identify which product-and-package combination is likely to set the line's practical limit.
A larger fill may constrain dosing while a different bottle or label constrains handling. Ask for the sustainable rate of each main SKU rather than accepting the best mechanical rate from a single demonstration.
Turn the observations into a specific improvement request
State the observed limiting event, required accepted output and conditions that must remain the same. Ask the supplier to explain how the proposed change addresses that event and whether it moves the constraint elsewhere.
For a new line, request an integrated test using the intended product and packaging. For an existing line, compare before and after under a comparable schedule. The useful outcome is a traceable improvement in accepted output, supported by a line record rather than an isolated speed increase at one station.
The [liquid filling production line page](/product/liquid-filling-production-line/) describes the current modular arrangement. For a capacity review, [send each SKU's fill volume, packaging samples, target finished bottles per shift and available staffing](/contact/). If a line already operates, include a short downtime log and the location where bottles accumulate.
Related guides
Related Products


Sizing equipment for your line?
Send the product, the batch size and the utilities you have. We reply with the model, the cycle time and what the cooling side needs.